Australian Solar Power Installations hit 5GW
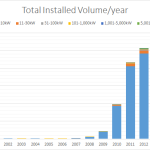
It’s official, there is now 5GW of solar power installed in Australia.
Five gigawatts: 5,000,000,000 Watts of solar power – its a number that’s hard to fathom. Indeed, solar power’s 5GW now represents 9% of Australia’s total electricity generation capacity of 56GW.
Statistics of this sort are often translated into more humanly-graspable figures by converting into the number of Australian households that could be powered by solar energy (1.25 million). Wow, pretty big figures! In fact, SunWiz recently calculated that there are over 23 million solar panels installed in Australia – a solar panel for every man woman and child.
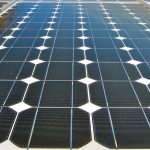
An Iconic Australian Solar Installation
The 5GW figure is even more impressive when related in terms of how much power humans themselves can generate. Imagine for a moment that you’re an elite cyclist and you’re cycling in the bunch (peleton) of the tour de france at 60km/h. Now an elite cyclist in this situation sustains an output of 250W of human power for a few hours, about the average power of one of today’s high-efficiency solar panels. On this basis, it would take a peleton of 20 million elite cyclists to produce the same power as Australia’s installed solar capacity. In other words, even if every able-bodied Australian simultaneously pedalled their bicycle as hard as they could, they still wouldn’t match the power output of Australia’s solar panels on a sunny day.
| State | <10kW | >10-20kW | >20-30kW | >30-50kW | >50-75kW | >75-100kW | 101-<1000kW | 1000-<5000kW | 5000+kW | Total |
| ACT | 43,786 | 3,770 | 1,263 | 362 | 373 | 946 | 2263 | 1600 | 24000 | 78,363 |
| NSW | 797,392 | 115,031 | 23,103 | 19,289 | 11,034 | 37,323 | 10,575 | 5,595 | 211,176 | 1,230,517 |
| NT | 18,328 | 2,251 | 958 | 1,440 | 873 | 2,722 | 3,342 | 6,997 | 0 | 36,911 |
| QLD | 1,368,628 | 43,315 | 23,913 | 11,683 | 4,876 | 10,839 | 6,375 | 9,460 | 0 | 1,479,089 |
| SA | 534,525 | 64,507 | 20,548 | 2,401 | 2,273 | 7,607 | 3,012 | 1,000 | 0 | 635,873 |
| TAS | 77,496 | 9,472 | 822 | 897 | 703 | 899 | 511 | 0 | 0 | 90,800 |
| VIC | 772,912 | 55,573 | 17,622 | 9,387 | 7,306 | 14,916 | 6,681 | 10,314 | 0 | 894,711 |
| WA | 478,155 | 20,139 | 13,260 | 12,139 | 2,776 | 8,718 | 7,232 | 2,000 | 10,270 | 554,689 |
| Total | 4,091,221 | 314,059 | 101,489 | 57,597 | 30,213 | 83,970 | 39,990 | 36,966 | 245,446 | 5,000,951 |
Solar power was the #1 new power source in 2015
Australia’s Largest PV Installations
The table below lists Australia’s largest PV installations in descending order of capacity (in kW).
102,000 AGL Energy – Nyngan Solar Plant
56,000 Fotowatio Renewable Venture (FRV) – Moree Solar Farm
53,000 AGL Energy – Broken Hill Solar Plant
24,000 Fotowatio Renewable Venture (FRV) – Royalla Solar Farm
10,000 Greenough River Solar Farm – Geraldton
3,500 Belectric Australia – Mildura Solar PV Power Plant
3,275 University of Queensland – Gatton
3,100 Epuron – TKLN Solar – Uterne 2
2,000 CBH Group – Moora Solar Power Station
1,700 Rio Tinto – Bauxite Mine, Weipa – Phase 1 of 6.7MW
1,500 Silex / Solar Systems – Mildura CPV Solar Power Station / Mildura Demonstration Facility
1,260 Ergon Energy – Doomadgee Solar Farm
1,250 Casuarina Shopping Square
1,220 Shellharbour Shopping Centre
1,100 Newington Athletes’ Olympic Village
1,060 Brisbane Market Ltd (BML)
1,029 Greenway Investments P/L
1,000 Epuron – TKLN Solar – Uterne 1
1,000 Ergon Energy – Magnetic Island Solar City
1,000 IKEA – Canberra (Majura Parkway)
1,000 Adelaide Showgrounds
989 IKEA – Tempe
950 IKEA – Springvale
753 Vawdrey’s Australia – Dandenong
741 IKEA – Logan
741 IKEA – Richmond
686 Eco for Life Solar Systems
650 IKEA – Marsden Park
636 The Pines Elanora Solar Project
600 Silex / Solar Systems – Bridgewater Test Facility
600 Amaroo School
500 Toyota – Altona Manufacturing Plant
A bright outlook for Solar power in 2016?
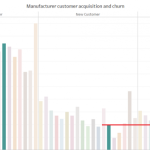
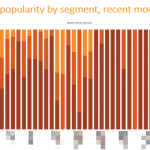
Last year the Australian PV industry grew overall, but this growth was solely due to the realisation of the projects borne of the Solar Flagships programme. Though there are a large number of utility-scale solar farms in early stages of development, most will commence deployment in 2017, meaning contraction in the solar industry is likely in 2016. Despite this and even as the volume of residential sales declines, there are sizeable opportunities in growth segments of the solar market, particularly in commercial and also in some highly favourable niches.
Which segments of the solar market will grow in 2016? What volume of PV will be Read SunWiz’s 2016 Strategic Predictions report to find out.